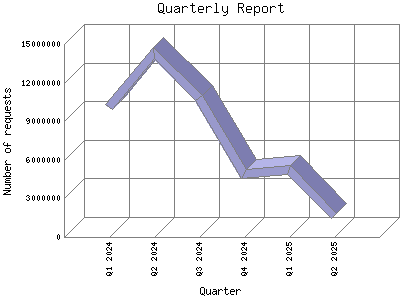
The Quarterly Report shows total activity on your site for each quarter of a
year. Remember that each page hit can result in several server requests as the
images for each page are loaded.
Note: Most likely, the first and
last quarters will not represent a complete quarter's worth of data, resulting
in lower hits.
| Quarter | Number of requests | Percentage of the requests | |
|---|---|---|---|
| 1. | Q3 2026 | 164,173 | 0.31% |
| 2. | Q2 2026 | 799,212 | 1.54% |
| 3. | Q1 2026 | 850,722 | 1.64% |
| 4. | Q4 2025 | 1,251,536 | 2.41% |
| 5. | Q3 2025 | 1,549,706 | 2.100% |
| 6. | Q2 2025 | 1,696,326 | 3.28% |
| 7. | Q1 2025 | 5,235,498 | 10.11% |
| 8. | Q4 2024 | 4,924,958 | 9.51% |
| 9. | Q3 2024 | 10,831,194 | 20.93% |
| 10. | Q2 2024 | 14,338,949 | 27.71% |
| 11. | Q1 2024 | 10,103,072 | 19.52% |
Most active quarter Q2 2024 : 14,338,949 requests handled.
Quarterly average: 4704122 requests handled.
This report was generated on July 26, 2026 01:26.
Report time frame January 11, 2024 06:00 to July 25, 2026 04:59.
| Web statistics report produced by: | |
 Analog 5.24 Analog 5.24 |  Report Magic for Analog 2.13 Report Magic for Analog 2.13 |