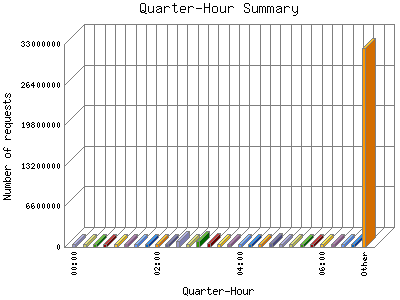
The Quarter-Hour Summary shows an overview of site activity over the course of a day, broken down into fifteen-minute intervals. If your report has enough traffic this will give you a detailed graph of your site's load throughout the day.
| Quarter-Hour | Number of requests | Percentage of the requests | |
|---|---|---|---|
| 1. | 00:00 | 518,978 | 1% |
| 2. | 00:15 | 516,301 | 0.100% |
| 3. | 00:30 | 517,983 | 1% |
| 4. | 00:45 | 535,704 | 1.3% |
| 5. | 01:00 | 546,198 | 1.6% |
| 6. | 01:15 | 531,408 | 1.2% |
| 7. | 01:30 | 523,811 | 1.1% |
| 8. | 01:45 | 525,250 | 1.1% |
| 9. | 02:00 | 533,005 | 1.3% |
| 10. | 02:15 | 521,505 | 1% |
| 11. | 02:30 | 946,314 | 1.82% |
| 12. | 02:45 | 530,162 | 1.2% |
| 13. | 03:00 | 945,568 | 1.82% |
| 14. | 03:15 | 697,717 | 1.34% |
| 15. | 03:30 | 543,729 | 1.6% |
| 16. | 03:45 | 526,496 | 1.1% |
| 17. | 04:00 | 543,275 | 1.6% |
| 18. | 04:15 | 532,245 | 1.2% |
| 19. | 04:30 | 518,029 | 1% |
| 20. | 04:45 | 731,402 | 1.41% |
| 21. | 05:00 | 576,462 | 1.11% |
| 22. | 05:15 | 534,923 | 1.3% |
| 23. | 05:30 | 524,818 | 1.1% |
| 24. | 05:45 | 529,128 | 1.2% |
| 25. | 06:00 | 524,493 | 1.1% |
| 26. | 06:15 | 538,705 | 1.4% |
| 27. | 06:30 | 516,318 | 0.100% |
| 28. | 06:45 | 516,820 | 0.100% |
| 29. | 07:00 | 519,965 | 1% |
| 30. | 07:15 | 524,121 | 1.1% |
| 31. | 07:30 | 516,449 | 0.100% |
| 32. | 07:45 | 518,717 | 1% |
| 33. | 08:00 | 535,067 | 1.3% |
| 34. | 08:15 | 597,568 | 1.16% |
| 35. | 08:30 | 526,384 | 1.1% |
| 36. | 08:45 | 519,461 | 1% |
| 37. | 09:00 | 523,982 | 1.1% |
| 38. | 09:15 | 507,185 | 0.99% |
| 39. | 09:30 | 512,653 | 0.100% |
| 40. | 09:45 | 516,419 | 0.100% |
| 41. | 10:00 | 520,296 | 1% |
| 42. | 10:15 | 524,962 | 1.1% |
| 43. | 10:30 | 505,096 | 0.98% |
| 44. | 10:45 | 520,058 | 1% |
| 45. | 11:00 | 508,501 | 0.99% |
| 46. | 11:15 | 515,357 | 0.100% |
| 47. | 11:30 | 511,220 | 0.99% |
| 48. | 11:45 | 516,568 | 0.100% |
| 49. | 12:00 | 503,881 | 0.98% |
| 50. | 12:15 | 515,609 | 0.100% |
| 51. | 12:30 | 506,711 | 0.98% |
| 52. | 12:45 | 507,435 | 0.99% |
| 53. | 13:00 | 504,829 | 0.98% |
| 54. | 13:15 | 505,537 | 0.98% |
| 55. | 13:30 | 504,839 | 0.98% |
| 56. | 13:45 | 497,598 | 0.97% |
| 57. | 14:00 | 512,553 | 0.100% |
| 58. | 14:15 | 514,867 | 0.100% |
| 59. | 14:30 | 502,526 | 0.98% |
| 60. | 14:45 | 502,889 | 0.98% |
| 61. | 15:00 | 501,024 | 0.97% |
| 62. | 15:15 | 901,210 | 1.74% |
| 63. | 15:30 | 594,151 | 1.14% |
| 64. | 15:45 | 504,514 | 0.98% |
| 65. | 16:00 | 551,235 | 1.7% |
| 66. | 16:15 | 515,263 | 0.100% |
| 67. | 16:30 | 519,461 | 1% |
| 68. | 16:45 | 556,552 | 1.8% |
| 69. | 17:00 | 518,275 | 1% |
| 70. | 17:15 | 508,364 | 0.99% |
| 71. | 17:30 | 511,175 | 0.99% |
| 72. | 17:45 | 516,892 | 0.100% |
| 73. | 18:00 | 556,328 | 1.8% |
| 74. | 18:15 | 507,878 | 0.99% |
| 75. | 18:30 | 507,653 | 0.99% |
| 76. | 18:45 | 510,229 | 0.99% |
| 77. | 19:00 | 513,255 | 0.100% |
| 78. | 19:15 | 538,706 | 1.4% |
| 79. | 19:30 | 508,260 | 0.99% |
| 80. | 19:45 | 509,742 | 0.99% |
| 81. | 20:00 | 515,257 | 0.100% |
| 82. | 20:15 | 507,984 | 0.99% |
| 83. | 20:30 | 510,367 | 0.99% |
| 84. | 20:45 | 530,788 | 1.2% |
| 85. | 21:00 | 508,587 | 0.99% |
| 86. | 21:15 | 530,241 | 1.2% |
| 87. | 21:30 | 525,632 | 1.1% |
| 88. | 21:45 | 517,993 | 1% |
| 89. | 22:00 | 529,106 | 1.2% |
| 90. | 22:15 | 519,804 | 1% |
| 91. | 22:30 | 518,652 | 1% |
| 92. | 22:45 | 520,807 | 1% |
| 93. | 23:00 | 525,173 | 1.1% |
| 94. | 23:15 | 530,101 | 1.2% |
| 95. | 23:30 | 517,840 | 1% |
| 96. | 23:45 | 520,797 | 1% |
This report was generated on July 26, 2026 01:26.
Report time frame January 11, 2024 06:00 to July 25, 2026 04:59.
| Web statistics report produced by: | |
 Analog 5.24 Analog 5.24 |  Report Magic for Analog 2.13 Report Magic for Analog 2.13 |